KITCHEN EMULSIONS
Kitchen emulsions are used in various recipes to enhance flavour, enhance moisture and improve texture of certain meals.
examples include:
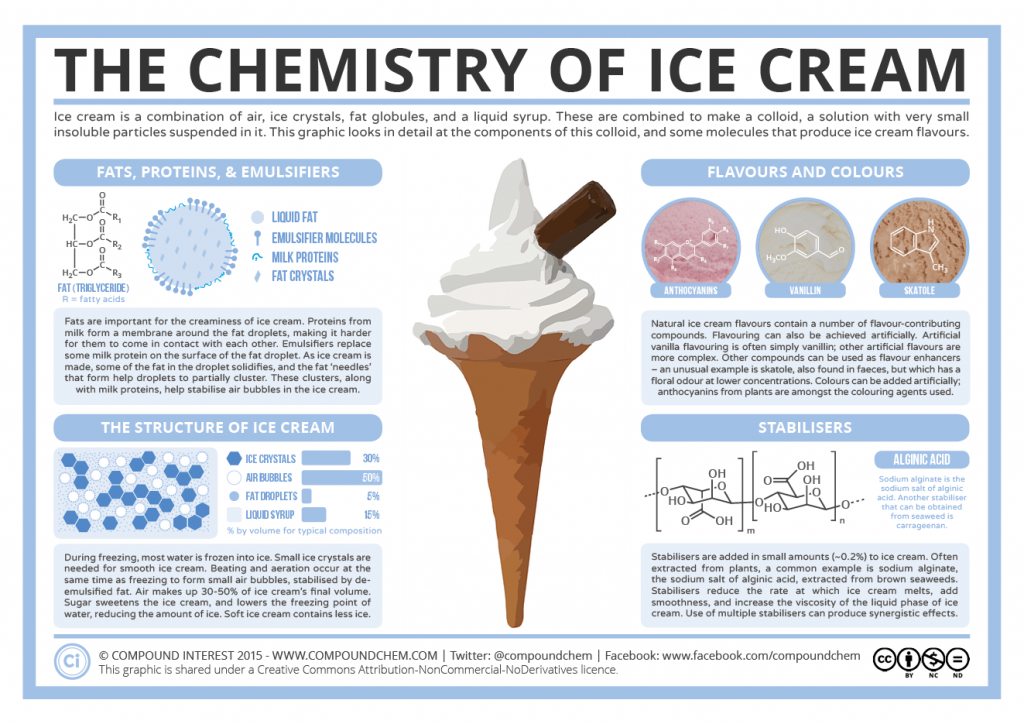
icecream
vinegrette
mayonnaise
milk(natural emulsion)
examples include:
icecream
vinegrette
mayonnaise
milk(natural emulsion)
Examples of kitchen emulsions
|
|
|
Links to infographics in kitchen chemistry
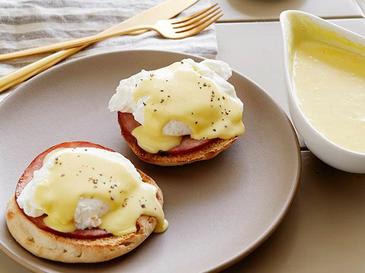
Example from: http://www.compoundchem.com/2016/03/26/eggs/
Cosmetic Emulsions
The main purpose of cosmetics which are made using an emulsion is to do with the main ingredients needed for the purpose of cosmetics.
Examples:
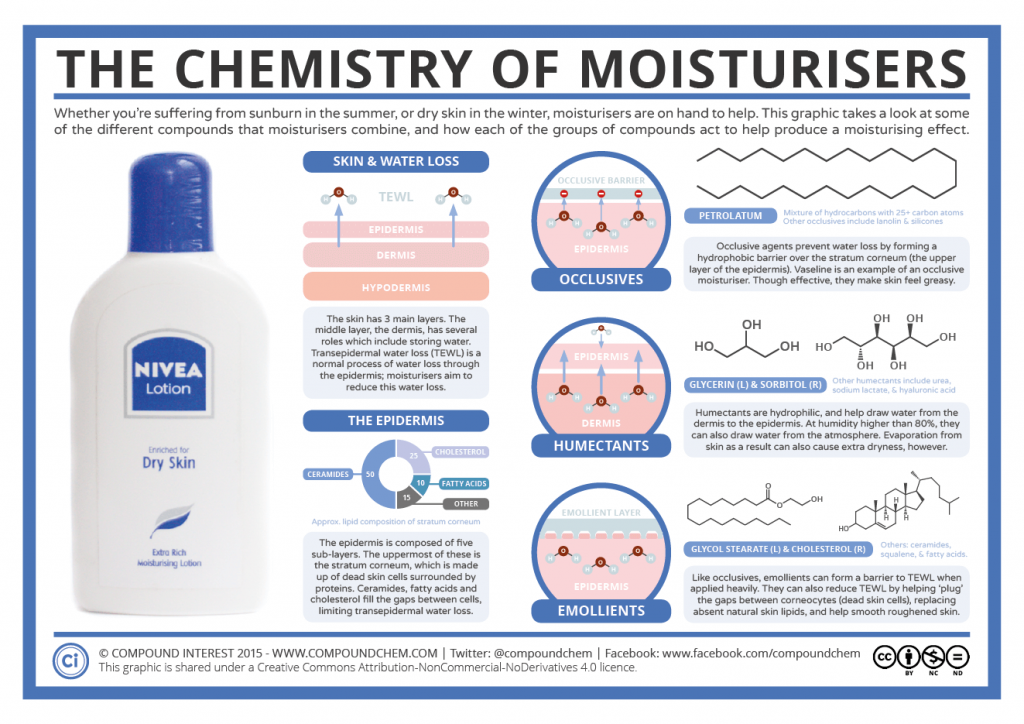
moisturisers- main ingredients consist of oil (to soften skin) and water (to hydrate skin) as well as different fragrances to make you smell good and different colourings.
Lipsticks- Main ingredients are beeswax (emulsifier and to give texture) oils (to soften lips) and water (to hydrate) as well as colour pigments for various looks and sometimes fragrances.
Some examples of making these products are explained below in various videos
Examples:
moisturisers- main ingredients consist of oil (to soften skin) and water (to hydrate skin) as well as different fragrances to make you smell good and different colourings.
Lipsticks- Main ingredients are beeswax (emulsifier and to give texture) oils (to soften lips) and water (to hydrate) as well as colour pigments for various looks and sometimes fragrances.
Some examples of making these products are explained below in various videos
|
|
|
Links to infographics in cosmetics
What is an infographic you ask? It is part B of assessment 8 and has these components:
An infographic (information graphic) is a representation of information in a graphic format designed to make the data easily understandable at a glance. People use infographics to quickly communicate a message, to simplify the presentation of large amounts of data, to see data patterns and relationships, and to monitor changes in variables over time.
- Bar graph
-line chart
-ingredients
-important info
- what it is representing
-photos
-diagrams
-mind maps
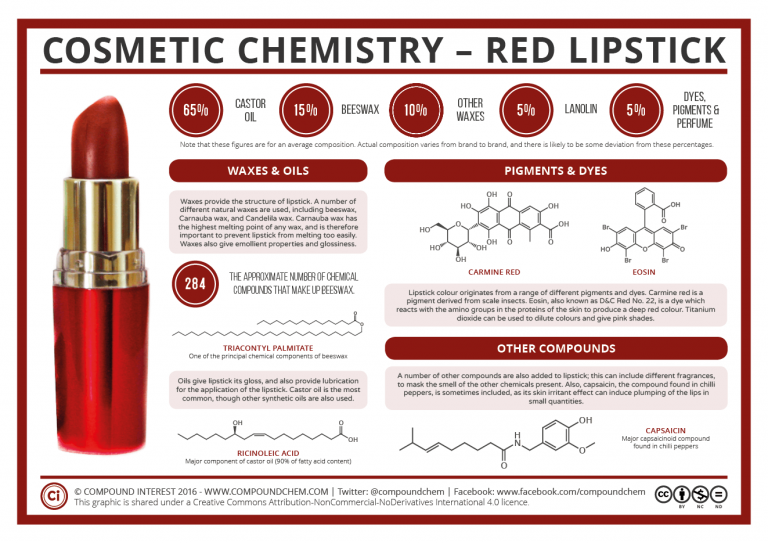
retrieved from: http://www.compoundchem.com/2014/08/18/lipstick/
